Zonal Wind Shear Index (Webster and Yang, 1992)
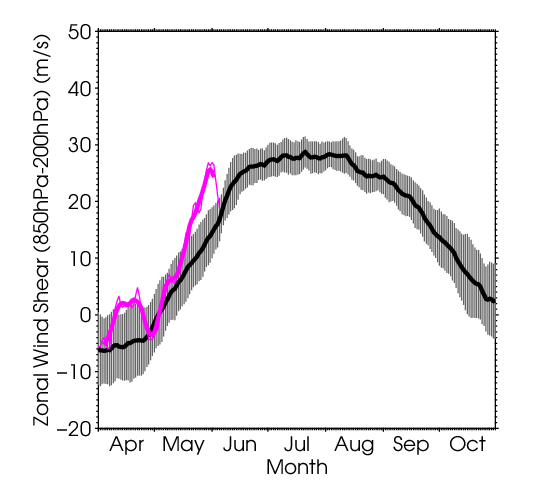
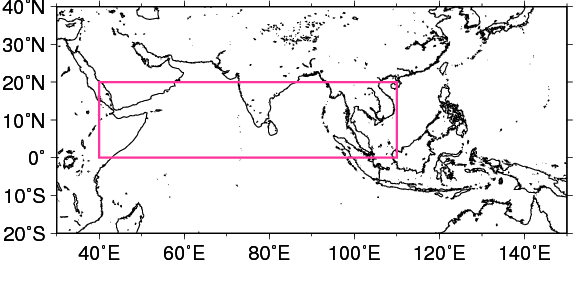
Time-series representation of the zonal wind shear index between 200 hPa and 850 hPa averaged over the North Indian Ocean and southern Asia (shown by the rectangle on the bottom: equator – 20°N, 40°E – 110°E). The zonal wind shear index is calculated after Webster and Yang (1992). The thick and thin pink lines indicate seven-day running mean and daily mean values, respectively. The black line denotes the normal (i.e., the 1991 – 2020 average), and the gray shading shows the range of the standard deviation calculated for the time period of the normal.
URL: https://ds.data.jma.go.jp/tcc/tcc/products/clisys/ASIA_TCC/monsoon_index.html
Northward Shift of Monsoon Activity
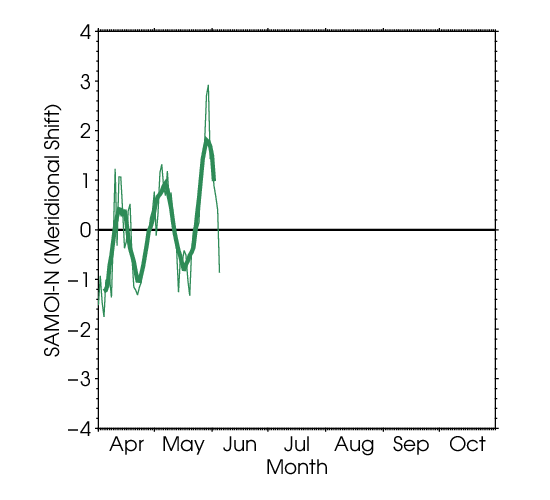
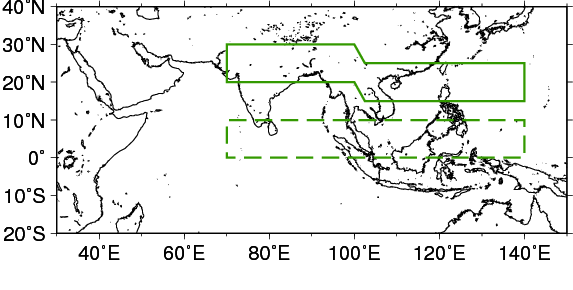
The OLR index (SAMOI-N) indicates the meridional shift of the active convection area associated with the Asian summer monsoon. SAMOI-N is defined as the difference between the reversed-sign area-averaged OLR anomalies over the area from northern India to northeast of the Philippines (shown by the area enclosed by the solid green line on the bottom) normalized by the standard deviation and those over the area from the central North Indian Ocean to southeast of the Philippines (shown by the area enclosed by the dashed green line on the bottom). Positive and negative SAMOI-N values indicate northward and southward shift of the active convection area, respectively, compared to the normal (i.e, the 1991 – 2020 average). The thick and thin green lines indicate seven-day running mean and daily mean values, respectively.
URL: https://ds.data.jma.go.jp/tcc/tcc/products/clisys/ASIA_TCC/monsoon_index.html