Weekly evolution of the 2023 Indian Summer Monsoon – Spatial Patterns of Weekly Rainfall
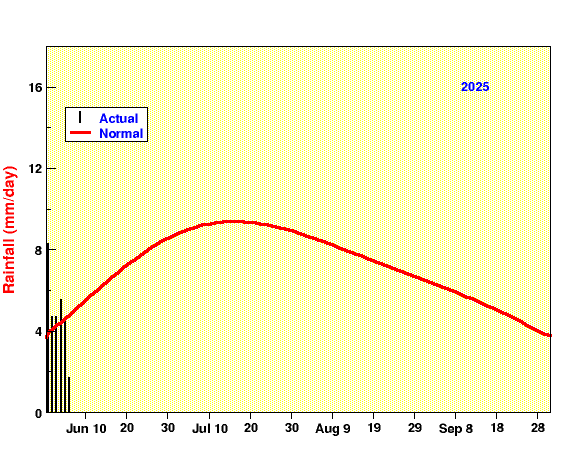
These charts are based on the weekly mean rainfall anomalies (percentage departures from the long-term mean for the corresponding week) for 36 meteorological subdivisions of India, computed from real-time reports and published in the Weekly Weather Reports issued by the India Meteorological Department. Spatial patterns for the month of May are displayed to give the idea of Monsoon Onset. Each row of the panels corresponds to the week ending the date indicated. In each row, the three panels indicate, from left to right, the mean daily rainfall in the week, the corresponding normal for the week and the percent departure.